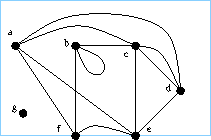
 %Exercise:
%It will be useful to
% represent a graph $g$ on a countable vertex set by a picture.
A plane drawn picture
$(R,S)$
is a closed rectangular interval of the plane $R$ together with a subset $S$
consisting of smoothly embedded line intervals terminating at
certain marked points.
The first thing to note is that such a thing can only be approximated by a `drawn picture' (or `sketch') in the artistic sense. Indeed there is nothing in the `physical laboratory' corresponding to a homeomorphic image of a real interval; just as a physical knot or braid is not much like a mathematical knot or braid. However, we will use PDPs in such a way that such approximations are generally sufficient. With this caveat we will speak of `drawing' PDPs, and indeed speak of pictures such as the one on the right as if they are PDPs.
In order to represent a graph $g=(V,E,f)$ by such a picture $(R,S)$,
one proceeds as follows.
First one draws marked points such that each may be identified with a
vertex in $V$.
Each edge $\epsilon$ in $E$ is then represented by a line interval
between the vertices in $f(\epsilon)$, and labelled by $\epsilon$.
There is much freedom of choice in this, but one wants
that a complete single line can be determined unambiguously from the
drawn set of lines.
To this end the set of line interval embeddings is
chosen to be
generic, in the sense that
if two lines meet at a point the tangents do not coincide,
and no line meets a marked point except at an endpoint.
(This is sophistry, in that it is not really possible to determine
tangents to lines by looking at pictures, except within some tolerance.
Thus if we use pictures in practice, tangents must not only be
different, but sufficiently different.)
In such a picture we shall call the boundary of the rectangular region the frame . A vertex may lie on the frame (call such a vertex exterior), but by convention a line interval may touch the frame only at its endpoints.
An alcove of such a picture $(R,S)$ is a connected component of $R \setminus S$. (See also here.) \subsection{Some `Night thoughts of a ... physicist' on this topic} \subsection{References} [CF] R H Crowell and R H Fox, Introduction to knot theory, Ginn 1963. [Moise] E E Moise, Geometric topology in dimensions 2 and 3, Springer-Verlag 1977. ...